3D Visualizer for ASPECT
Project Overview

Analysis of large 3D datasets is difficult on traditional desktop software, as the limited perspective often clutters the view or hides important detail. Previous experience has demonstrated that these visualization challenges are overcome with interactive and immersive virtual reality (VR) tools. Building off of the research done at the UC Davis KeckCAVES, the DataLab will extend the capability of our current 3D data visualization software 3D Visualizer to read and visualize emerging hierarchical mesh data structures such as those used by the community-developed ASPECT simulation code.
As our understanding of mantle-tectonic systems in the earth has grown, so too has the need for the increased model resolution these new data formats provide. With these new upgrades, users will be able to collaboratively explore geologic models to the sub-kilometer scale, allowing them to capture all relevant physical processes.
Research Approach
This project will focus on two components: 1) create a module inside 3D Visualizer to represent and visualize hierarchical meshes produced by the ASPECT code; and 2) create a reader to load ASPECT simulation results from files in HDF5 format. The HDF5 format is a container format optimized for high-performance parallel reads and writes. Reading ASPECT data from HDF5 files will decrease software resource requirements, and be more compatible with existing workflows. The standard format also means researchers won’t have to re-format their existing data before loading them into 3D Visualizer.
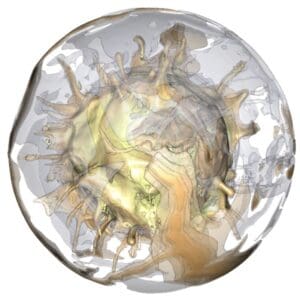
Two sample data sets will be used to enable development and testing. The first data set is for a regional model of subduction in a Cartesian geometry. The second data is a global model of mantle convection in a spherical geometry (Example shown).
Potential Impact
Achieving the goals of the start-up project will make 3D Visualizer available to the growing community of ASPECT users worldwide. Even if users choose to use 3D Visualizer on a normal workstation, they will have a superior tool for visual analysis of the model results. Some users will be able to purchase low-cost VR workstations ($2500-$3000) to take full advantage of 3D Visualizer’s VR capabilities and remote collaboration. This improved new data visualization tool will likely lead to faster and more accurate interpretation of complex model flow fields and related deformation data.
Second, this project will also open the door to use 3D Visualizer with other simulation or imaging software that store data in HDF5 files. Given 3D Visualizer can be used for any kind of gridded data set—physics, engineering, hydrology, atmospheric sciences—there is the potential to move 3D visualization of complex simulations into a new paradigm of collaborative VR analysis.
Team
DataLab
- Oliver Kreylos (technical lead)